Note
Access to this page requires authorization. You can try signing in or changing directories.
Access to this page requires authorization. You can try changing directories.
You can debug JavaScript and TypeScript code using Visual Studio. You can hit breakpoints, attach the debugger, inspect variables, view the call stack, and use other debugging features.
Debug server-side script
With your project open in Visual Studio, open a server-side JavaScript file (such as server.js), click in the gutter to set a breakpoint:
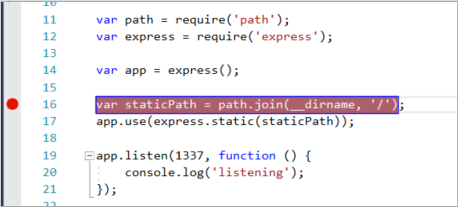
Breakpoints are the most basic and essential feature of reliable debugging. A breakpoint indicates where Visual Studio should suspend your running code, so you can look at the values of variables or the behavior of memory, or whether or not a branch of code is getting run.
To run your app, press F5 (Debug > Start Debugging).
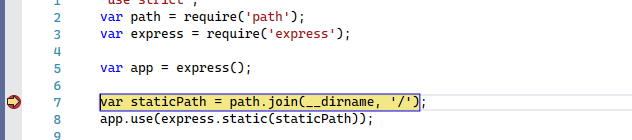
The debugger pauses at the breakpoint you set (IDE highlights the statement in the yellow background). Now, you can inspect your app state by hovering over variables currently in scope, using debugger windows like the Locals and Watch windows.
Press F5 to continue the app.
If you want to use the Chrome Developer Tools, press F12 in the Chrome browser. Using these tools, you can examine the DOM or interact with the app using the JavaScript Console.
Debug client-side script
Visual Studio provides client-side debugging support only for Chrome and Microsoft Edge. In some scenarios, the debugger automatically hits breakpoints in JavaScript and TypeScript code and embedded scripts on HTML files.
Note
For ASP.NET and ASP.NET Core, debugging embedded scripts in .CSHTML files isn't supported. JavaScript code must be in separate files to enable debugging.
Prepare your app for debugging
If your source is minified or created by a transpiler like TypeScript or Babel, use source maps for the best debugging experience. You can even attach the debugger to a running client-side script without the source maps. However, you might only be able to set and hit breakpoints in the minified or transpiled file, not in the source file. For example, in a Vue.js app, the minified script gets passed as a string to an eval statement, and there's no way to step through this code effectively using the Visual Studio debugger unless you use source maps. For complex debugging scenarios, you might want to use Chrome Developer Tools or F12 Tools for Microsoft Edge instead.
For help with generating source maps, see Generate source maps for debugging.
Manually configure the browser for debugging
For this scenario, use either Microsoft Edge or Chrome.
Close all windows for the target browser, either Microsoft Edge or Chrome instances.
Other browser instances can prevent the browser from opening with debugging enabled. (Browser extensions might be running and intercept full debug mode, so you might need to open Task Manager to find and close unexpected instances of Chrome or Edge.)
For best results, shut down all instances of Chrome, even if you're working with Microsoft Edge. Both the browsers use the same chromium code base.
Start your browser with debugging enabled.
Starting in Visual Studio 2019, you can set the
--remote-debugging-port=9222flag at browser launch by selecting Browse With... > from the Debug toolbar.If you don't see the Browse With... command in the Debug toolbar, select a different browser, and then retry.
From the Browse With dialog box, choose Add, and then set the flag in the Arguments field. Use a different friendly name for the browser, like Edge Debug Mode or Chrome Debug Mode. For details, see the Release Notes.
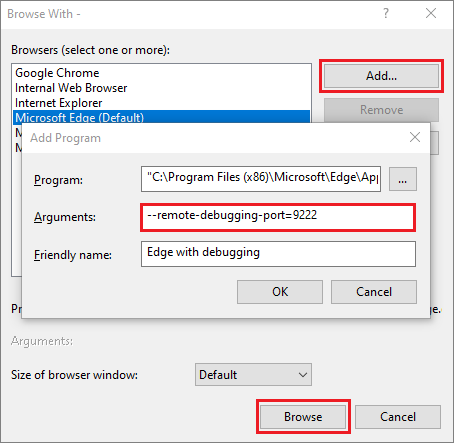
Select Browse to start your app with the browser in debug mode.
Alternatively, open the Run command from the Windows Start button (right-click and choose Run), and enter the following command:
msedge --remote-debugging-port=9222or,
chrome.exe --remote-debugging-port=9222This starts your browser with debugging enabled.
The app isn't yet running, so you get an empty browser page. (If you start the browser using the Run command, you need to paste in the correct URL for your app instance.)