Note
Access to this page requires authorization. You can try signing in or changing directories.
Access to this page requires authorization. You can try changing directories.
Mobile devices have limited processing power, network connectivity, and battery compared to desktops and laptops. To increase the adoption of your Teams tab app on mobile devices, you must ensure a fast and responsive web experience on the Teams Android and iOS clients. This article outlines the best practices to optimize your Teams tab's webpages for the Teams mobile client.
Use service workers to cache static assets
- Cache static assets such as HTML, CSS, JavaScript, and images to reduce network dependency.
- Use the stale-while-revalidate strategy to serve cached content quickly while fetching updated data in the background. You can also use this strategy to cache API responses that don't change frequently, such as configuration data.
- Avoid caching large assets to prevent unnecessary storage consumption on mobile devices.
Sample app
Check out this sample app that uses a service worker to cache data and provide offline functionality.
Minimize webpage size
In areas with weak signal strength, mobile data network can be slow and unstable, resulting in high latency. Hence, reducing the overall app package size and optimizing data transfers is critical. To reduce the page size, gather key performance metrics by running a performance audit using the Performance tab in dev tools. The performance audit helps identify bottlenecks and areas for improvement in your app.
Performance audit
To run a performance audit, follow these steps:
Open dev tools and select inspect under your app. A new window opens.
Select the Performance tab. You can see a performance marker indicating the time it takes for your app from Teams JavaScript SDK initialization to the
notifySuccesscall. You can use this marker to examine the network or local operations performed betweeninit()andnotifySuccess.In the following example, the Timings section shows that the app takes 2.20 seconds from Teams JavaScript SDK initialization to
notifySuccess, makes two calls to get an authorization token, and makes a third API call that takes 1.5 seconds.
Select the Lighthouse tab. This tab provides insights into the app size and performance metrics.
Under Device, select Mobile.
Select Analyze page load.
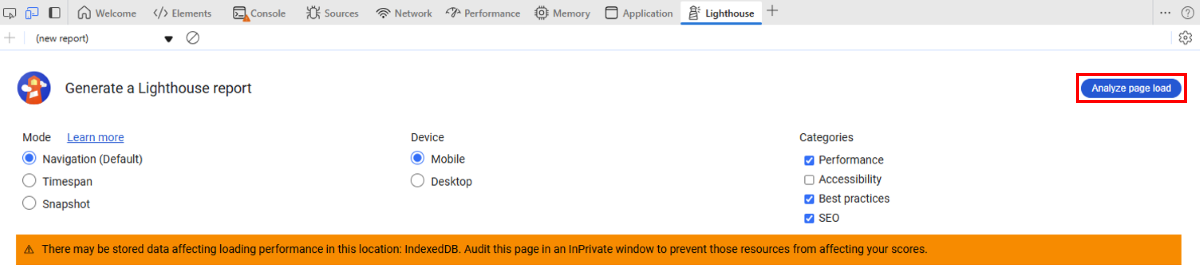
The report shows various diagnostics for your app's webpage and a set of actionable insights to decrease page load. Take the required steps to reduce the latencies flagged in this report.
Select the Coverage tab. Your webpage might contain unused resources that don't provide any value to the functionality of the app. This tab allows you to see the actual size and usage percentage of the resources on the webpage.
If you can't find it in the home page of dev tools, go to More tools > Coverage.

Use the report to remove unused code or resources.


Calculate performance metrics for apps
Use the self-serve, lightweight Performance Report tool (or Perf tool) to evaluate the efficiency of your web and tab apps on mobile. This tool runs seamlessly on both Android and iOS, and provides real-time performance metrics mapped against industry benchmarks, ensuring a superior user experience. It also enables you to implement Teams-specific best practices into your app directly from your mobile device.
The steps involved are:
- Generate performance metrics report
- Access performance metrics report
- Analyze performance metrics report
Note
For accurate latency calculation, ensure that your app calls the notifySuccess() API after it's fully loaded.
Generate performance metrics report
To generate performance metrics report for your mobile app with the Performance Report tool, follow these steps:
On your Teams mobile app, go to Settings > About > Developer preview and toggle the switch to enable Developer preview.

Go to the Apps section.
Open the app you want to audit, wait for it to load.
To generate the report
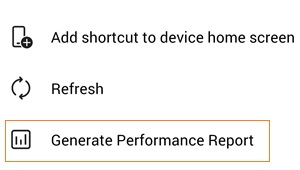
On Android app:
Select the kebab
 menu.
menu.Select Generate Performance Report.
On iOS app, select the audit app performance
 icon that appears on the title bar.
An interim page appears while the report is being generated for both Android and iOS.
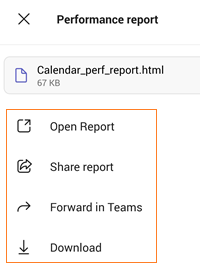
After the report is generated, access it from the bottom sheet that appears with the html performance report.


Note
- There's no restriction on the number of times that a report can be generated for an app.
- The generated report is a static html page whose contents remain unchanged throughout the journey. A new report is generated only when you repeat the report generation process.
- Refreshing or navigating away interrupts the process.
- If the report isn't generated, an error message appears.
Access performance metrics report
The report provides insights using JavaScript SDK and WebView APIs, along with Teams-specific performance markers.
You can access the report from the following options on the bottom sheet:
Open Report: Opens the report in a new browser window.
Share report: Opens the device’s options for sharing outside Teams on Android. On iOS, this option opens the device’s share menu.
Forward in Teams: Opens the device’s share menu for sharing in Teams. This option is available only on Android.
Download: Downloads the report in the device’s local storage.

Analyze performance metrics report
The performance metrics report contains the following metrics.
| Metric | Description | System response/Action required |
|---|---|---|
| Latency | This metric measures the (approximate) time taken by your Teams mobile app to load. |
|
| Caching (Service Worker) | This metric shows if service worker is implemented as a local caching mechanism. Service worker is available only on Android. | If service worker is implemented, Available is displayed in green, else Not Available is displayed in red. When service worker is Not Available, use the Learn more link to proceed with implementation. 
|
| App Package | This metric indicates the total size occupied by platform app's JavaScript file bundle. | Ideal package size is up to 1 MB. If package size exceeds the ideal size, the size is displayed in red. Select Check bundle files to get a detailed list of files affecting bundle size. 
The files affecting bundle size appear in descending order of file size. 
Use service worker and other best practices to optimize your app's performance. |
| Content Paint Metrics | This metric indicates all relevant content paint metrics (and their values) for your mobile app. | Content paint metrics show how fast visual elements appear while your app page loads. Use this data to identify and fix delays in visual content rendering.

|
| Disk Size | Indicates the app size on your mobile device. | Ideal limit is 20 MB. If an app is larger than the ideal limit, the metric is displayed in red else in green. If your app's disk size can’t be calculated, an error message shows up.

|


Note
- Latency isn't calculated if
notifySuccess()API isn't called from code. - Use service worker caching mechanism as one way to optimize app performance.
See also
Collaborate with us on GitHub
The source for this content can be found on GitHub, where you can also create and review issues and pull requests. For more information, see our contributor guide.
Platform Docs