Note
Access to this page requires authorization. You can try signing in or changing directories.
Access to this page requires authorization. You can try changing directories.
Note
This capability is available as an Intune add-on. For more information, see Use Intune Suite add-on capabilities.
The anomalies report in Advanced Analytics helps IT admins proactively identify device health issues before they affect users. It monitors for application hangs, crashes, and Stop Error Restarts, providing visibility into problems before they reach support channels.
The feature correlates deployment objects and configuration changes to speed troubleshooting and suggest root causes. Device correlation groups reveal patterns among affected devices and flag others that are at risk.
Before you begin
- Review Scores, baselines, and insights in endpoint analytics to understand these concepts.
- Confirm that your environment meets all prerequisites.
Review the report
- In the Microsoft Intune admin center, select Reports > Endpoint analytics > Overview.
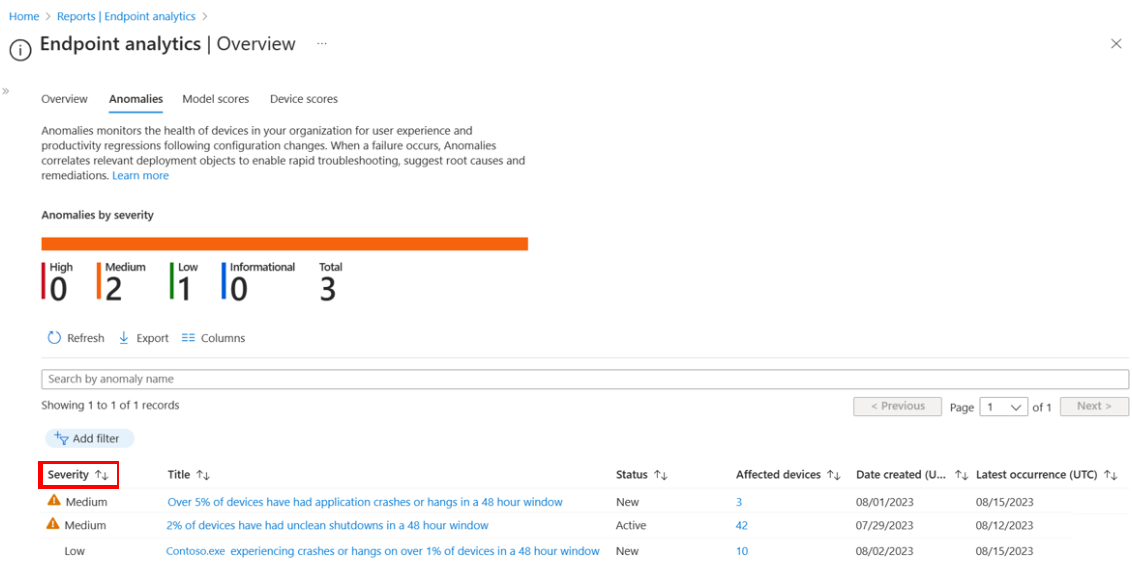
- Select the Anomalies tab, which provides an overview of the anomalies detected in your organization.
- Use sorting and filtering capabilities to refine the list of anomalies.
- To view more information about a specific anomaly, select it from the list. Review details such as the app name, affected devices, when the issue was first detected and last occurred, and any device groups that might be contributing to the problem.

- Select a device correlation group from the list to see common factors among devices. Devices are correlated by shared attributes such as app version, driver update, OS version, or device model. You can view the number of devices currently affected and those at risk. The prevalence rate shows the percentage of affected devices in a correlation group.

- Select View Affected Devices to display a list of devices with key attributes. Filter to view devices in specific correlation groups or show all devices affected by the anomaly. The device timeline also shows additional anomalous events.

Review anomaly detection data
Investigate flagged device correlation groups using the device timeline and resource reports to determine root causes. Device correlation groups help identify root causes for high and medium severity anomalies, as well as at-risk devices that may be impacted in the future.
Best practices:
- Periodically review the anomalies dashboard to understand the current baseline and prioritize investigations and resolutions for new issues.
- Investigate new reported issues to identify common factors, such as device hardware, as shown in advanced analytics.
- Prioritize anomalies to investigate based on severity and internal knowledge, such as application criticality.
- Use the device timeline report to check for patterns, such as device restarts or updates tied to anomalies.
- Work with IT teams to identify other factors, such as recent application updates, that could impact anomalies.
- Review possible remediation actions noted in the anomaly report (for example, driver or application updates).
- Integrate resolutions into L1/L2 support to keep teams aware of current known issues. Consider working with your ITSM team to record known anomalies under investigation.
- Test remediation actions on a subset of devices and monitor results before rolling out to more devices. After remediation, proactively roll out to at-risk devices.
- Review anomalies reports after major updates or incidents to check for new issues that need investigation and resolution.
- To better understand detection methods, review the statistical models used by anomaly detection.
Statistical models for determining anomalies
The analytical model detects device cohorts facing anomalous sets of Stop Error Restarts and application hangs or crashes that need admin attention. Patterns identified from sensor telemetry and diagnostics logs determine these device cohorts.
- Threshold-based heuristic model: This model sets one or more threshold values for application hangs, crashes, or Stop Error Restarts. Devices are flagged as anomalous if they breach the set threshold. The model is simple and effective for surfacing prominent or static issues. Thresholds are currently predetermined and not customizable.
- Paired t-tests model: Paired t-tests compare pairs of observations in a dataset, looking for statistically significant differences between their means. For example, comparing Stop Error Restarts on the same device before and after a policy change, or app crashes after an OS update.
- Population Z-score model: This model calculates the standard deviation and mean of a dataset, then uses those values to determine which data points are anomalous. The Z-score for each data point represents the number of standard deviations from the mean. Data points outside a certain range are considered anomalous. This model is well suited for highlighting outlier devices or apps but requires large datasets to be accurate.
- Time series Z-score model: This variation of the Z-score model is designed for detecting anomalies in time series data—sequences of data points collected at regular intervals, such as Stop Error Restarts over time. Standard deviation and mean are calculated for a sliding window, allowing the model to adapt to temporal patterns and changes in data distribution.
Note
Device cohorts are only identified for medium and high-severity anomalies.
