Note
Access to this page requires authorization. You can try signing in or changing directories.
Access to this page requires authorization. You can try changing directories.
Real-time dashboards show key metrics, help you spot anomalies, and let you make fast, informed decisions. By using Copilot, you can use natural language to explore the live data behind your real-time dashboard, each tile, or in KQL tables. Ask questions, refine visuals, and uncover and share insights without needing to use KQL query language.
After exploring data by using Copilot, save insights to the dashboard for quick access, view streaming or near real-time updates, and share them with your team.
Important
This feature is in preview.
Note
Currently, Copilot-assisted data exploration in real-time dashboards supports dashboards with a single data source and View mode only.
Prerequisites
- A workspace with a Microsoft Fabric-enabled capacity.
- A dashboard with visuals. Learn more in Create a real-time dashboard.
Explore dashboards with Copilot
Use Copilot to explore data in the context of the entire dashboard or of a specific tile. Ask questions about the overall data, request summaries, or seek insights that span multiple tiles. For example, you can change the time frame, filter by a column or value, calculate an average or total, or group by a column. Each time you explore the data with Copilot, you can view the data updates in Copilot, and when ready you can save the insights as a new tile in the dashboard.
In your Fabric workspace, select a real-time dashboard, or create a new dashboard.
By default, the Copilot pane opens in the context of the entire dashboard. Ensure that you are in Viewing mode.
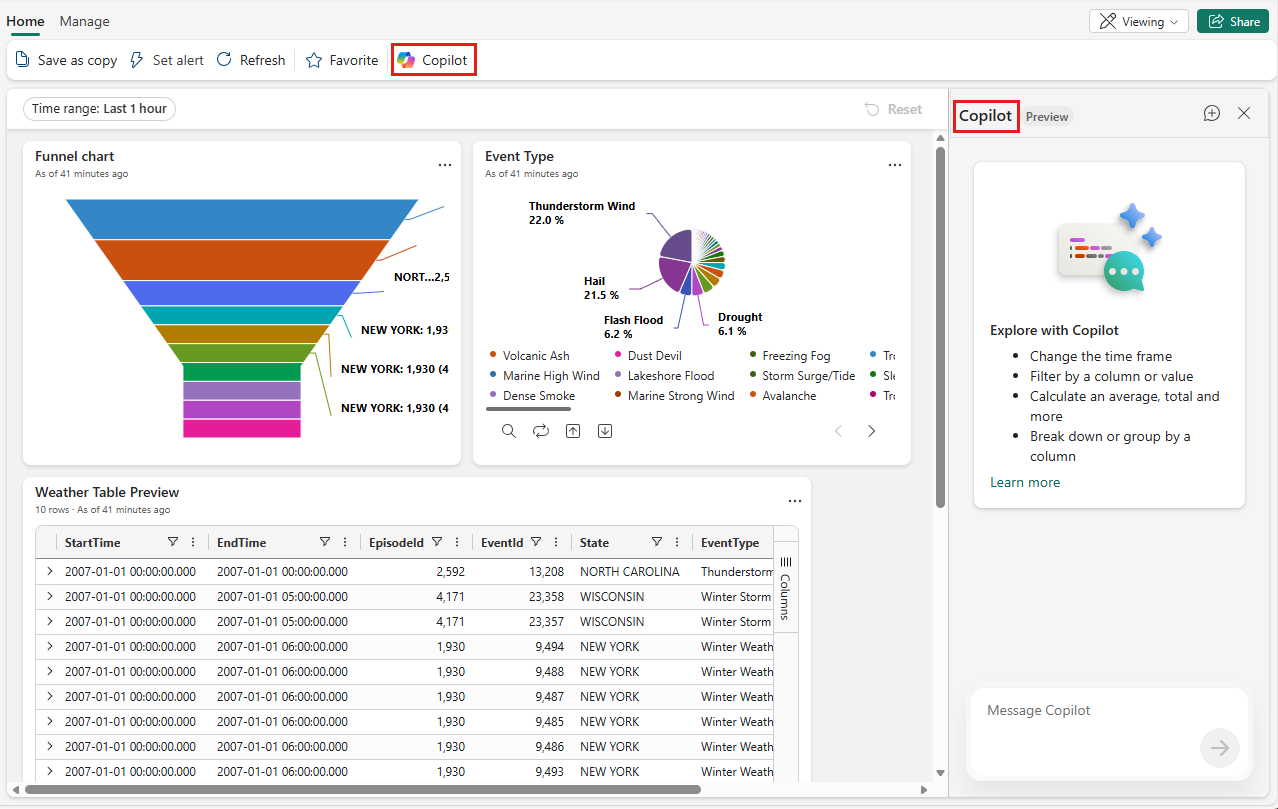
To explore data at the dashboard level: In the Copilot pane, ask a question or make a request about the data in the dashboard. For example, "Show me the total sales by region" or "What are the top five products by revenue?".

To focus your exploration using a specific tile: Select the Explore Data icon on the tile to explore the data.

A prompt appears to help you ask questions about the data in that tile. Use the prompt to guide your exploration, or enter a question or request directly in the text box.

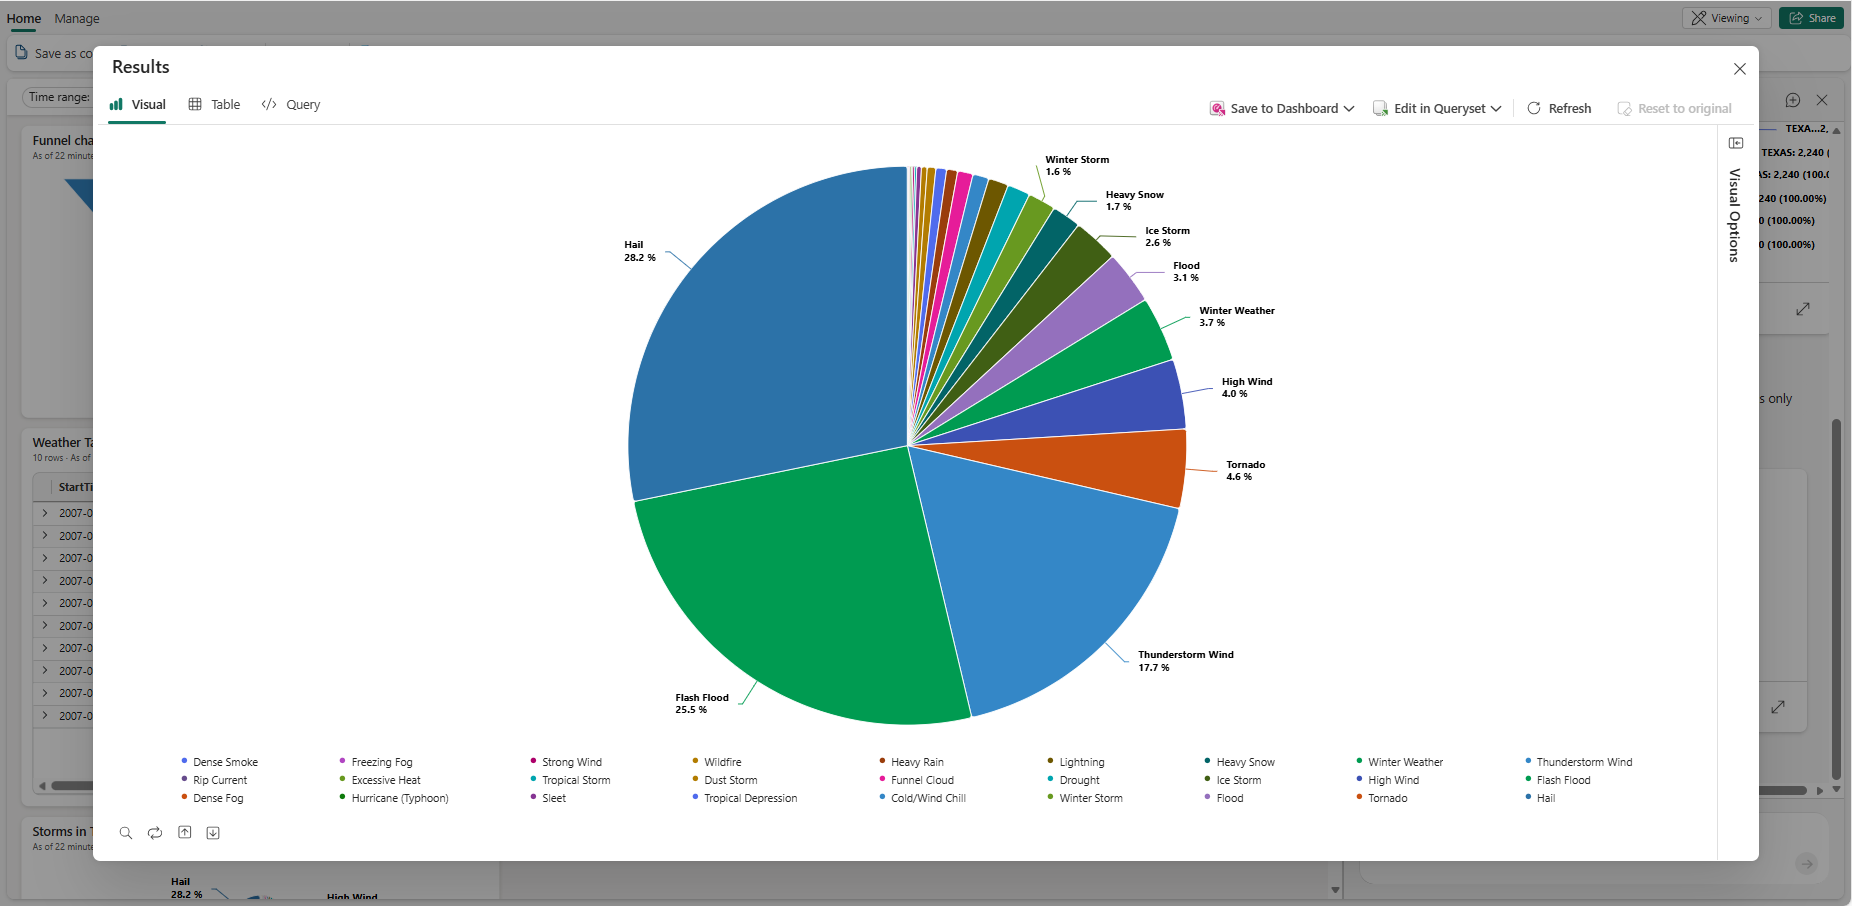
For this example, enter "Show me data for Texas only," and select the Submit arrow.
In the Copilot pane, you see your query and the response to your query including a preview of the new data. You can also toggle between the Visual, Table, and Query tabs to see different representations of the data inside the Copilot pane.


Use Copilot in tile editing to author KQL
When you open a tile in Edit mode, Copilot can help you author or modify the tile's KQL query directly in the editing pane. This capability is separate from the dashboard exploration feature and provides a powerful way to create and refine tile queries without manually writing KQL.
To use Copilot in tile editing:
- Open a Real-Time Dashboard and switch to Editing mode.
- Select the Edit tile pencil icon on the tile you want to modify.
- In the tile editing pane, select the Copilot icon.
- Enter a natural language prompt describing what you want to visualize or how you want to modify the query. For example:
- "Show the top 10 customers by sales in the last 7 days"
- "Add a filter for region equals 'West'"
- "Group the results by product category"
Copilot provides the following options:
- Generate: Create a new KQL query from your natural language prompt.
- Replace: Generate a new query that replaces the tile's existing query entirely.
- Refine: Modify the current query by adding filters, changing time windows, adjusting groupings, or making other refinements.
After Copilot generates the query, review it in the Query tab. You can run the query to preview the results, make manual edits if needed, and then apply the changes to update the tile.
Continue data exploration
Ask a question or make a request about the data. For example, "Show me the total sales by region" or "What are the top five products by revenue?"
Continue exploring and drill through the data by asking follow-up questions or making more requests.
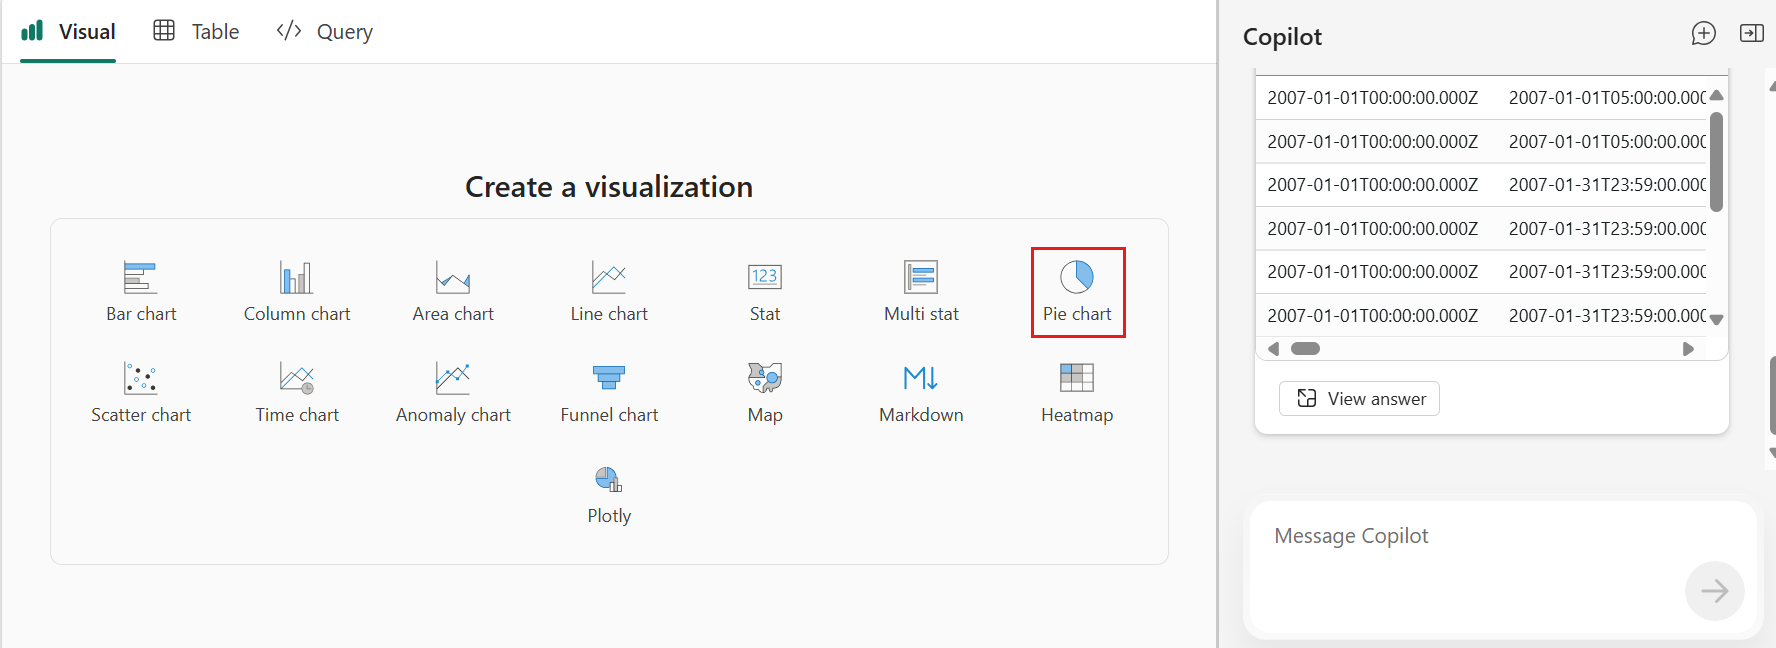
The filtered data appears in the Copilot pane. Select the expand icon to see the results reflected in the Visual, Table, and Query tabs.
Continue exploring and drilling through the data by asking more questions or modifying the visual manually using the Visual Options pane. For more information on customizing the visual, see Customize Real-Time Dashboard visuals.
When you're ready to save your insights to the dashboard, select Save to dashboard. This action saves the current view and query as a new tile on the dashboard.
Each saved tile stays connected to your live data, so as the data updates, your visual does too.