Note
Access to this page requires authorization. You can try signing in or changing directories.
Access to this page requires authorization. You can try changing directories.
The preview experience in ontology (preview) lets you view and explore your instantiated ontology data. The experience includes basic data previews, instance data, and a graph view.
When your ontology (preview) item is created, a Graph in Microsoft Fabric child item is also created and is responsible for storing and displaying data in the ontology preview experience.
Important
This feature is in preview.

Prerequisites
Before using the preview experience, make sure you have the following prerequisites:
- A Fabric workspace with a Microsoft Fabric-enabled capacity.
- Ontology item (preview) and Graph (preview) enabled on your tenant.
- An ontology (preview) item with data binding completed.
Key concepts
The preview experience uses the following ontology (preview) concepts. For definitions of these terms, see the Ontology (preview) glossary.
- Entity type
- Entity instance
- Preview experience
- Graph in Microsoft Fabric
Access preview experience
Follow these steps to access the preview experience in your ontology (preview) item and see the entity type overview.
In the Entity Types pane, select the entity type that you want to view. Select Entity type overview.

The preview experience opens.

In the preview experience, you see an overview for the entity type that lets you preview the data of all the entity instances. There are multiple ways to explore the data in this view:
View and create tiles: You can view data in line charts and create more tiles as needed. You can also configure time-specific slices for the tiles.
Use graph view: You can view your entity instances in a graph view provided through Graph in Microsoft Fabric. You can also open your entity directly in Graph in Microsoft Fabric, where you can see more options for drilling down into your data and learning about your instantiated ontology.
Explore entity instances: You can browse to a specific entity instance to get more information about the instance in the instance view.
View and create tiles
The preview experience in ontology (preview) automatically shows tiles that display data about your entity types, including entity instance details and relationship graphs. All tiles you create at the entity level also appear at the entity instance level.
To create more tiles, follow these steps.
From the ribbon, select + Add Tile.
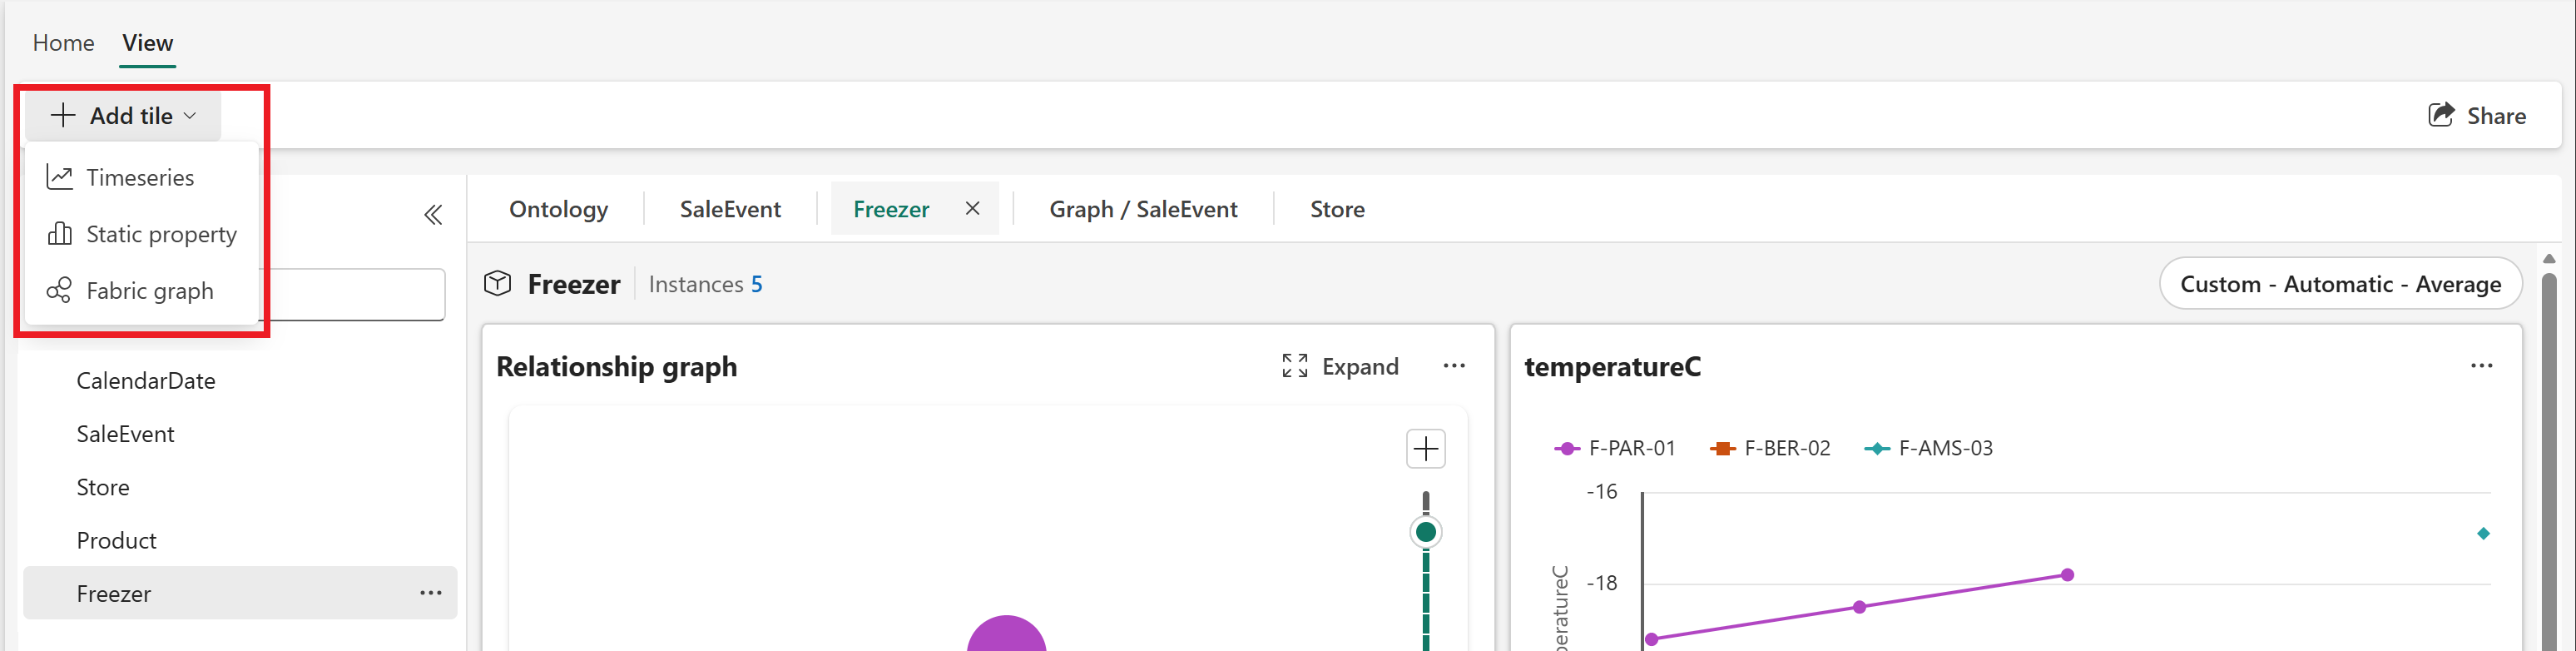
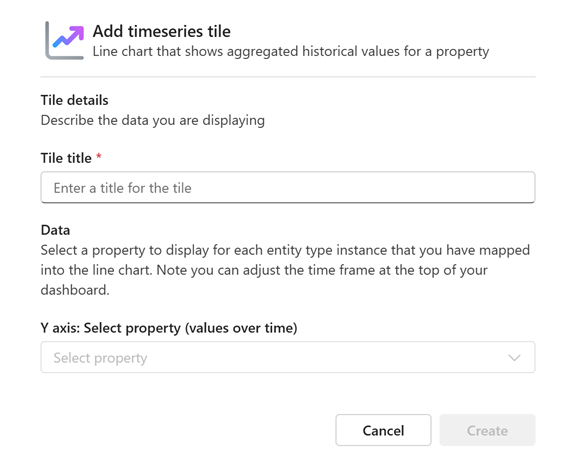
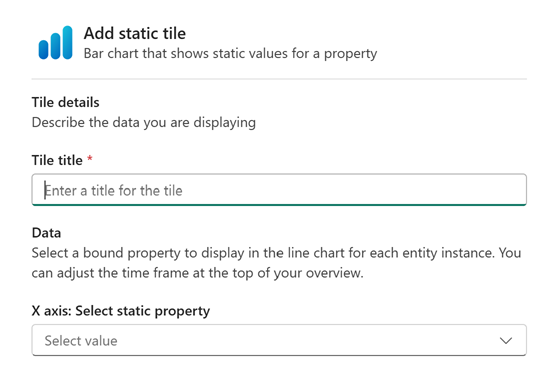
Select the type of tile you want to create: a Timeseries (time series) line chart for streaming data, a Static property bar chart for static data, or Fabric graph for a relationship graph provided by Graph in Microsoft Fabric. Only one graph tile is allowed per dashboard.
Complete the configuration for your chosen tile type.
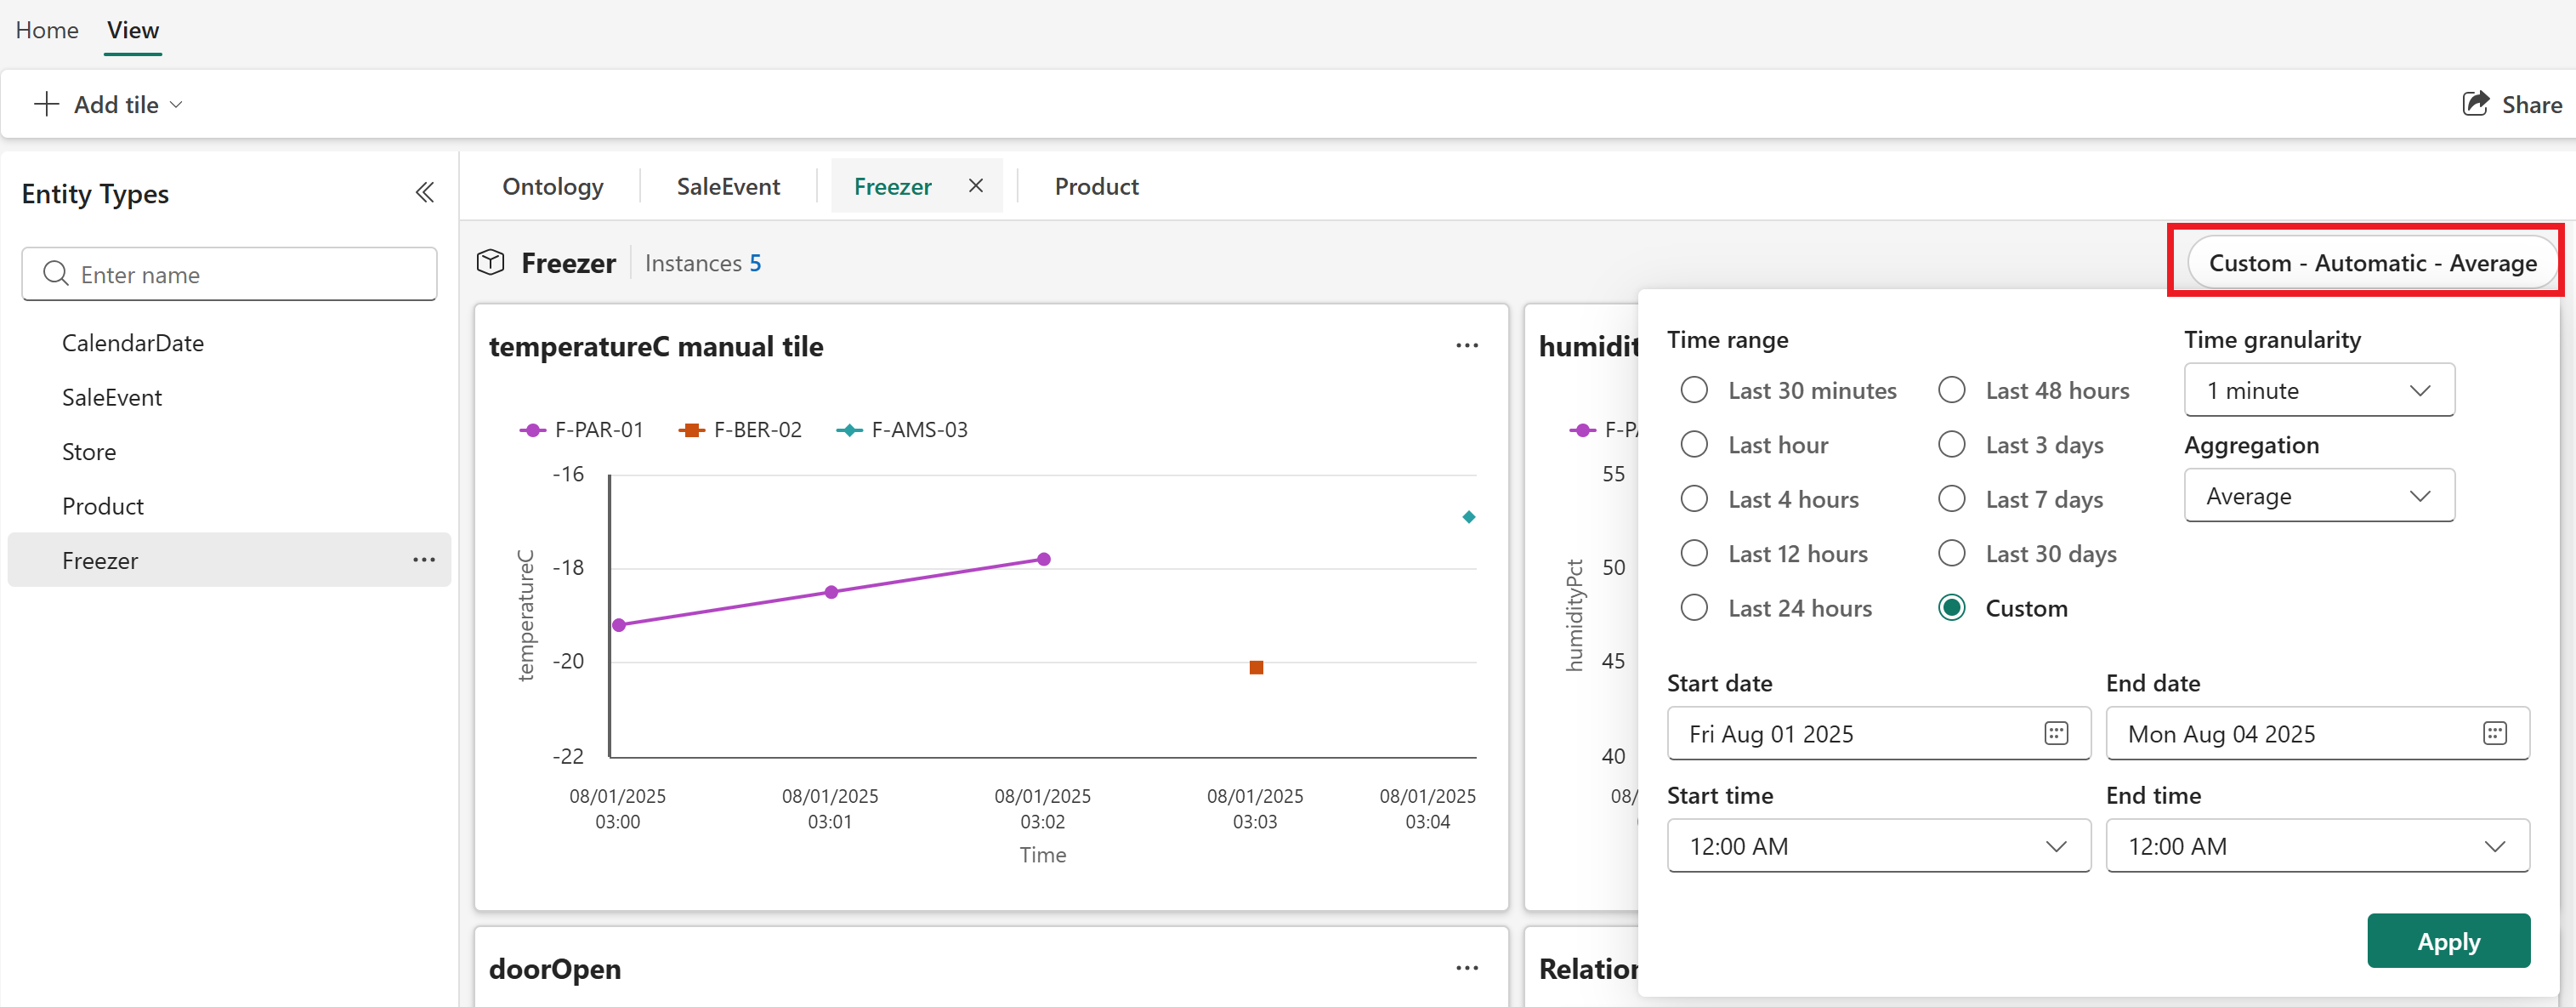
Back on the overview page, verify that your new tile is visible.
Use the time range selector to configure the time range for the data displayed in the tiles.

To edit or delete existing tiles, select ... in the upper right corner of a tile.

Use graph view
Follow these steps to view your ontology (preview) entities in a graph view provided by Graph in Microsoft Fabric.
Select Expand from a graph tile in the preview experience.
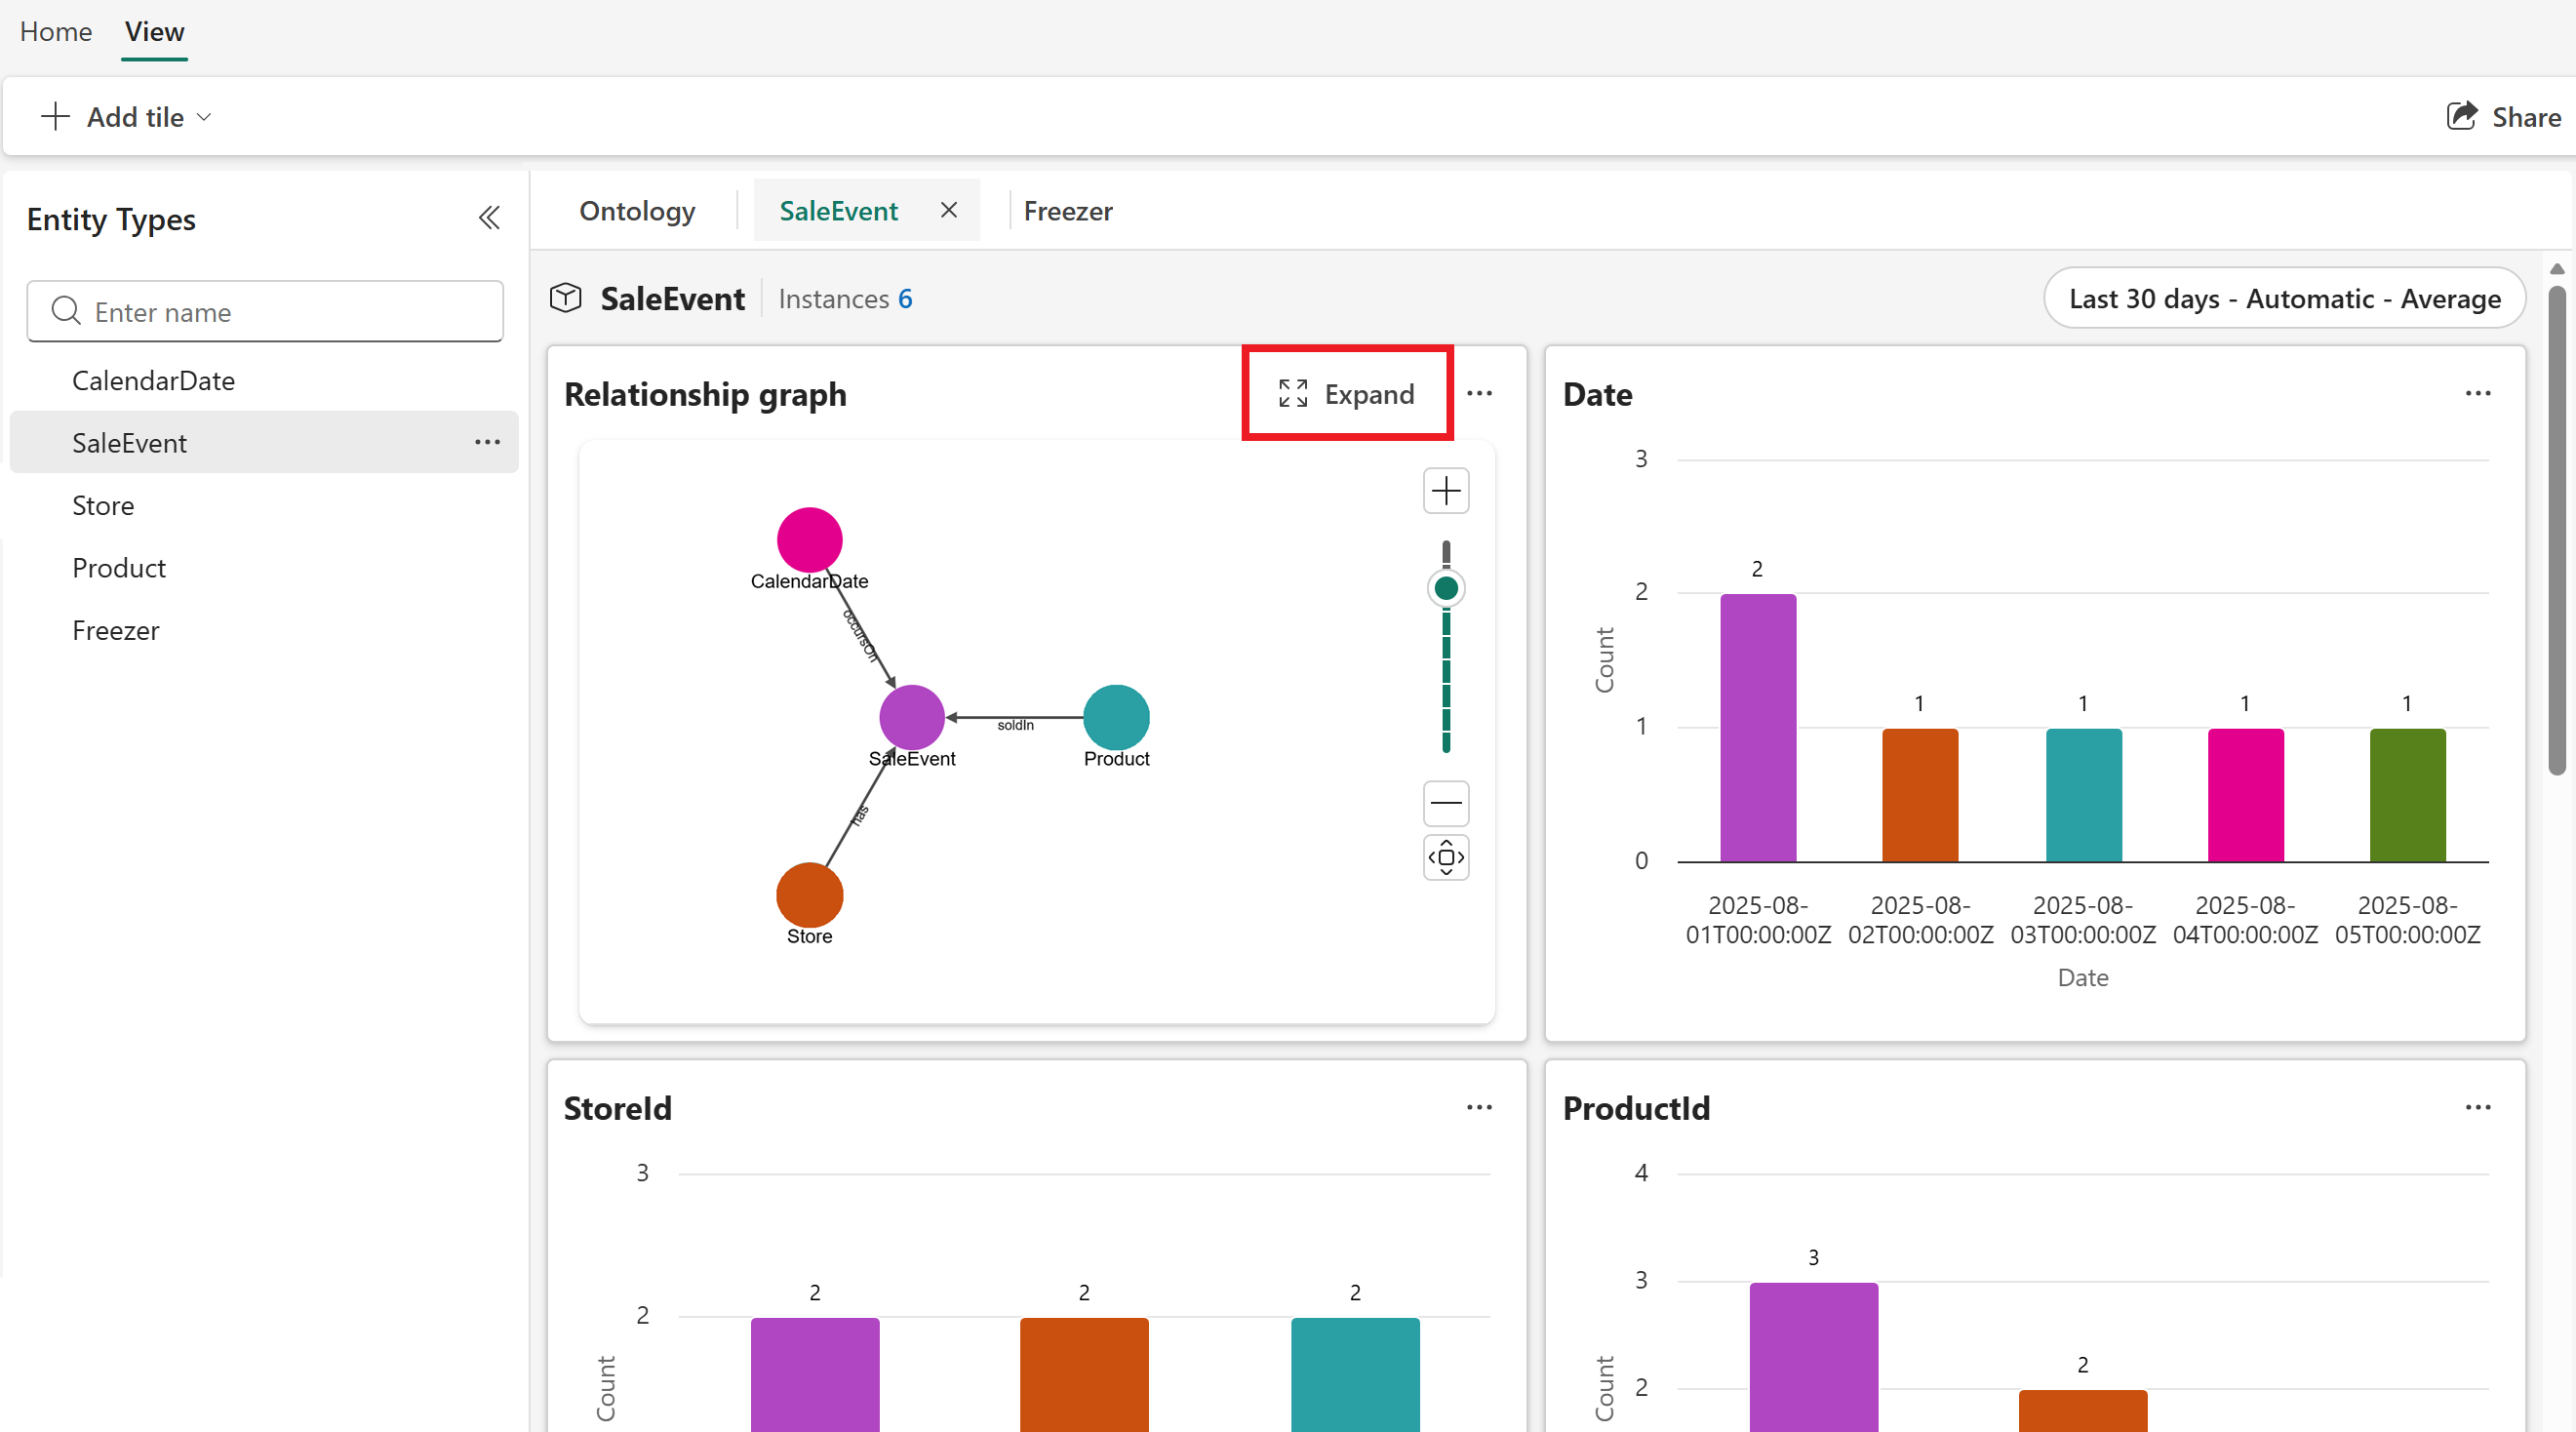
The full graph view opens:


In the graph view, you can explore using Graph in Microsoft Fabric's interface, and craft custom queries as described in the next section.
Query across entity instances
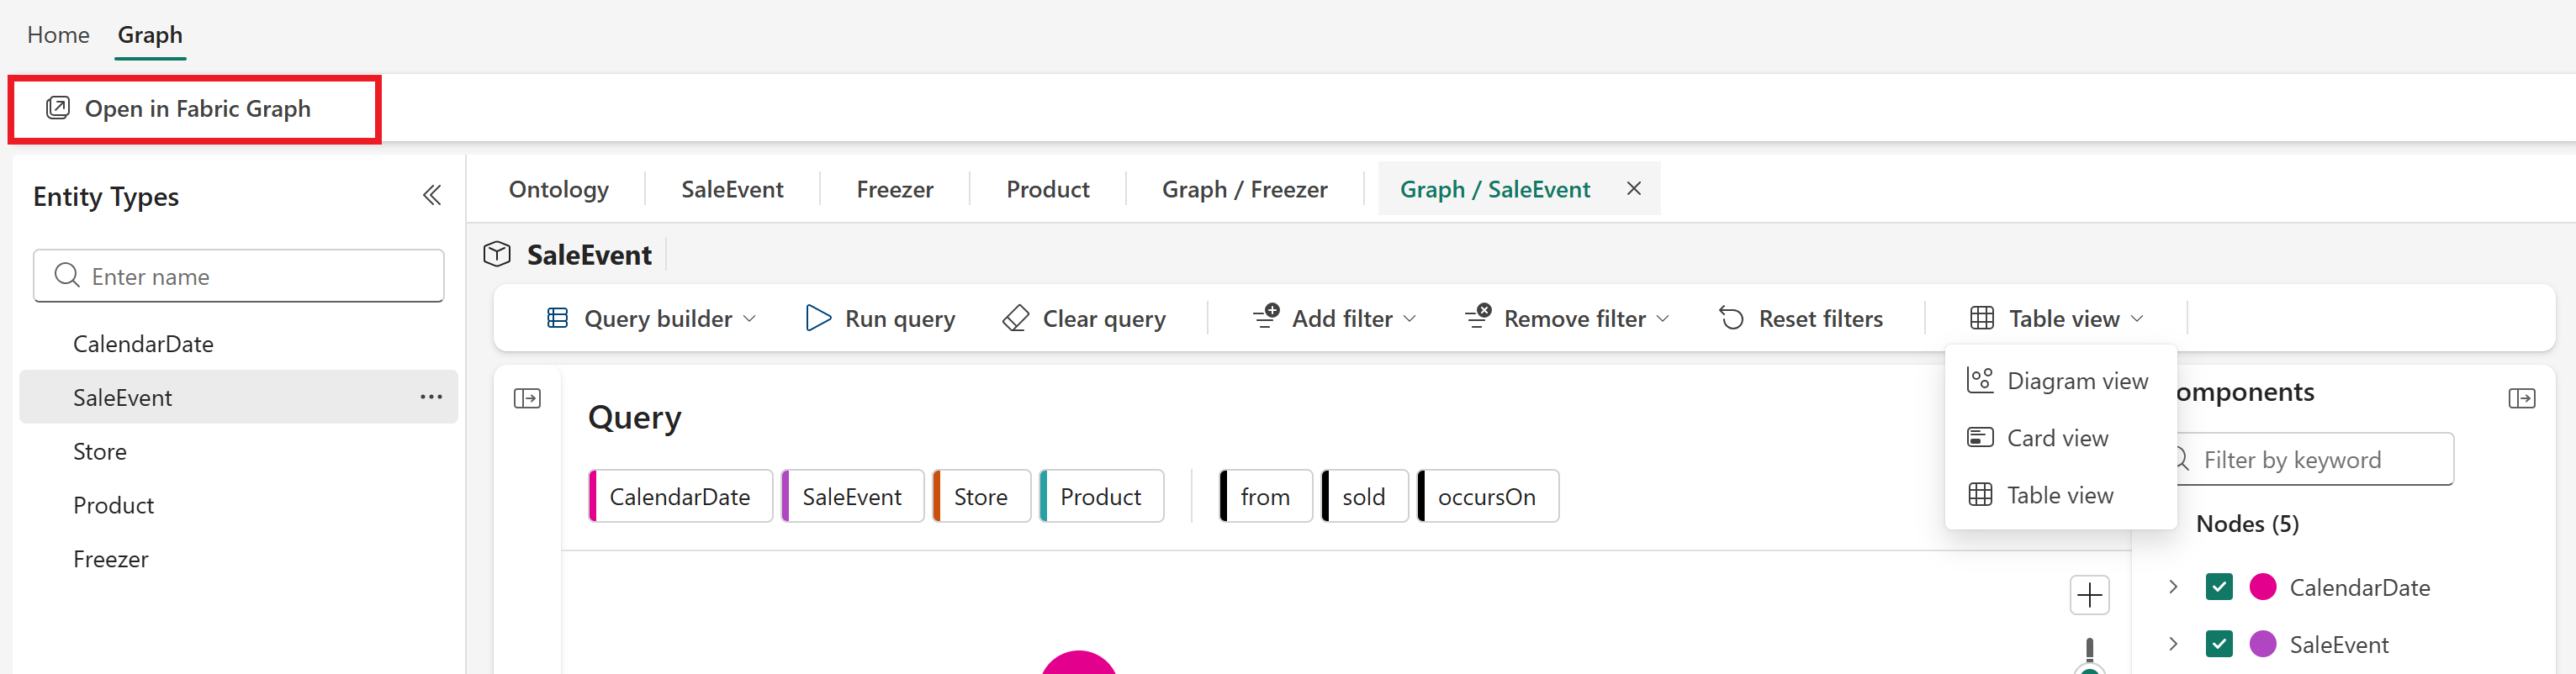
In the full graph view, use the Query builder ribbon to craft custom queries.

The default query shows the current entities and all relationships that are one hop away. Select Run query to run the default query. You see the results in a pane underneath the relationship type graph.

To change the query, you can Add filters for property values, or change the Components that are visible in the graph.

You can also change the view type of the query results, from Diagram to Card or Table.

To run more complex queries or explore the data in more detail, navigate to the Graph in Microsoft Fabric interface by selecting Open in Fabric Graph. For more information, see Graph in Microsoft Fabric overview (preview).
Explore entity instances
You can browse to a specific entity instance that's bound to your ontology (preview) item to see more information about that specific instance.
To open the instance view, start in the overview page for the entity type, and select a row from the Entity instances table.
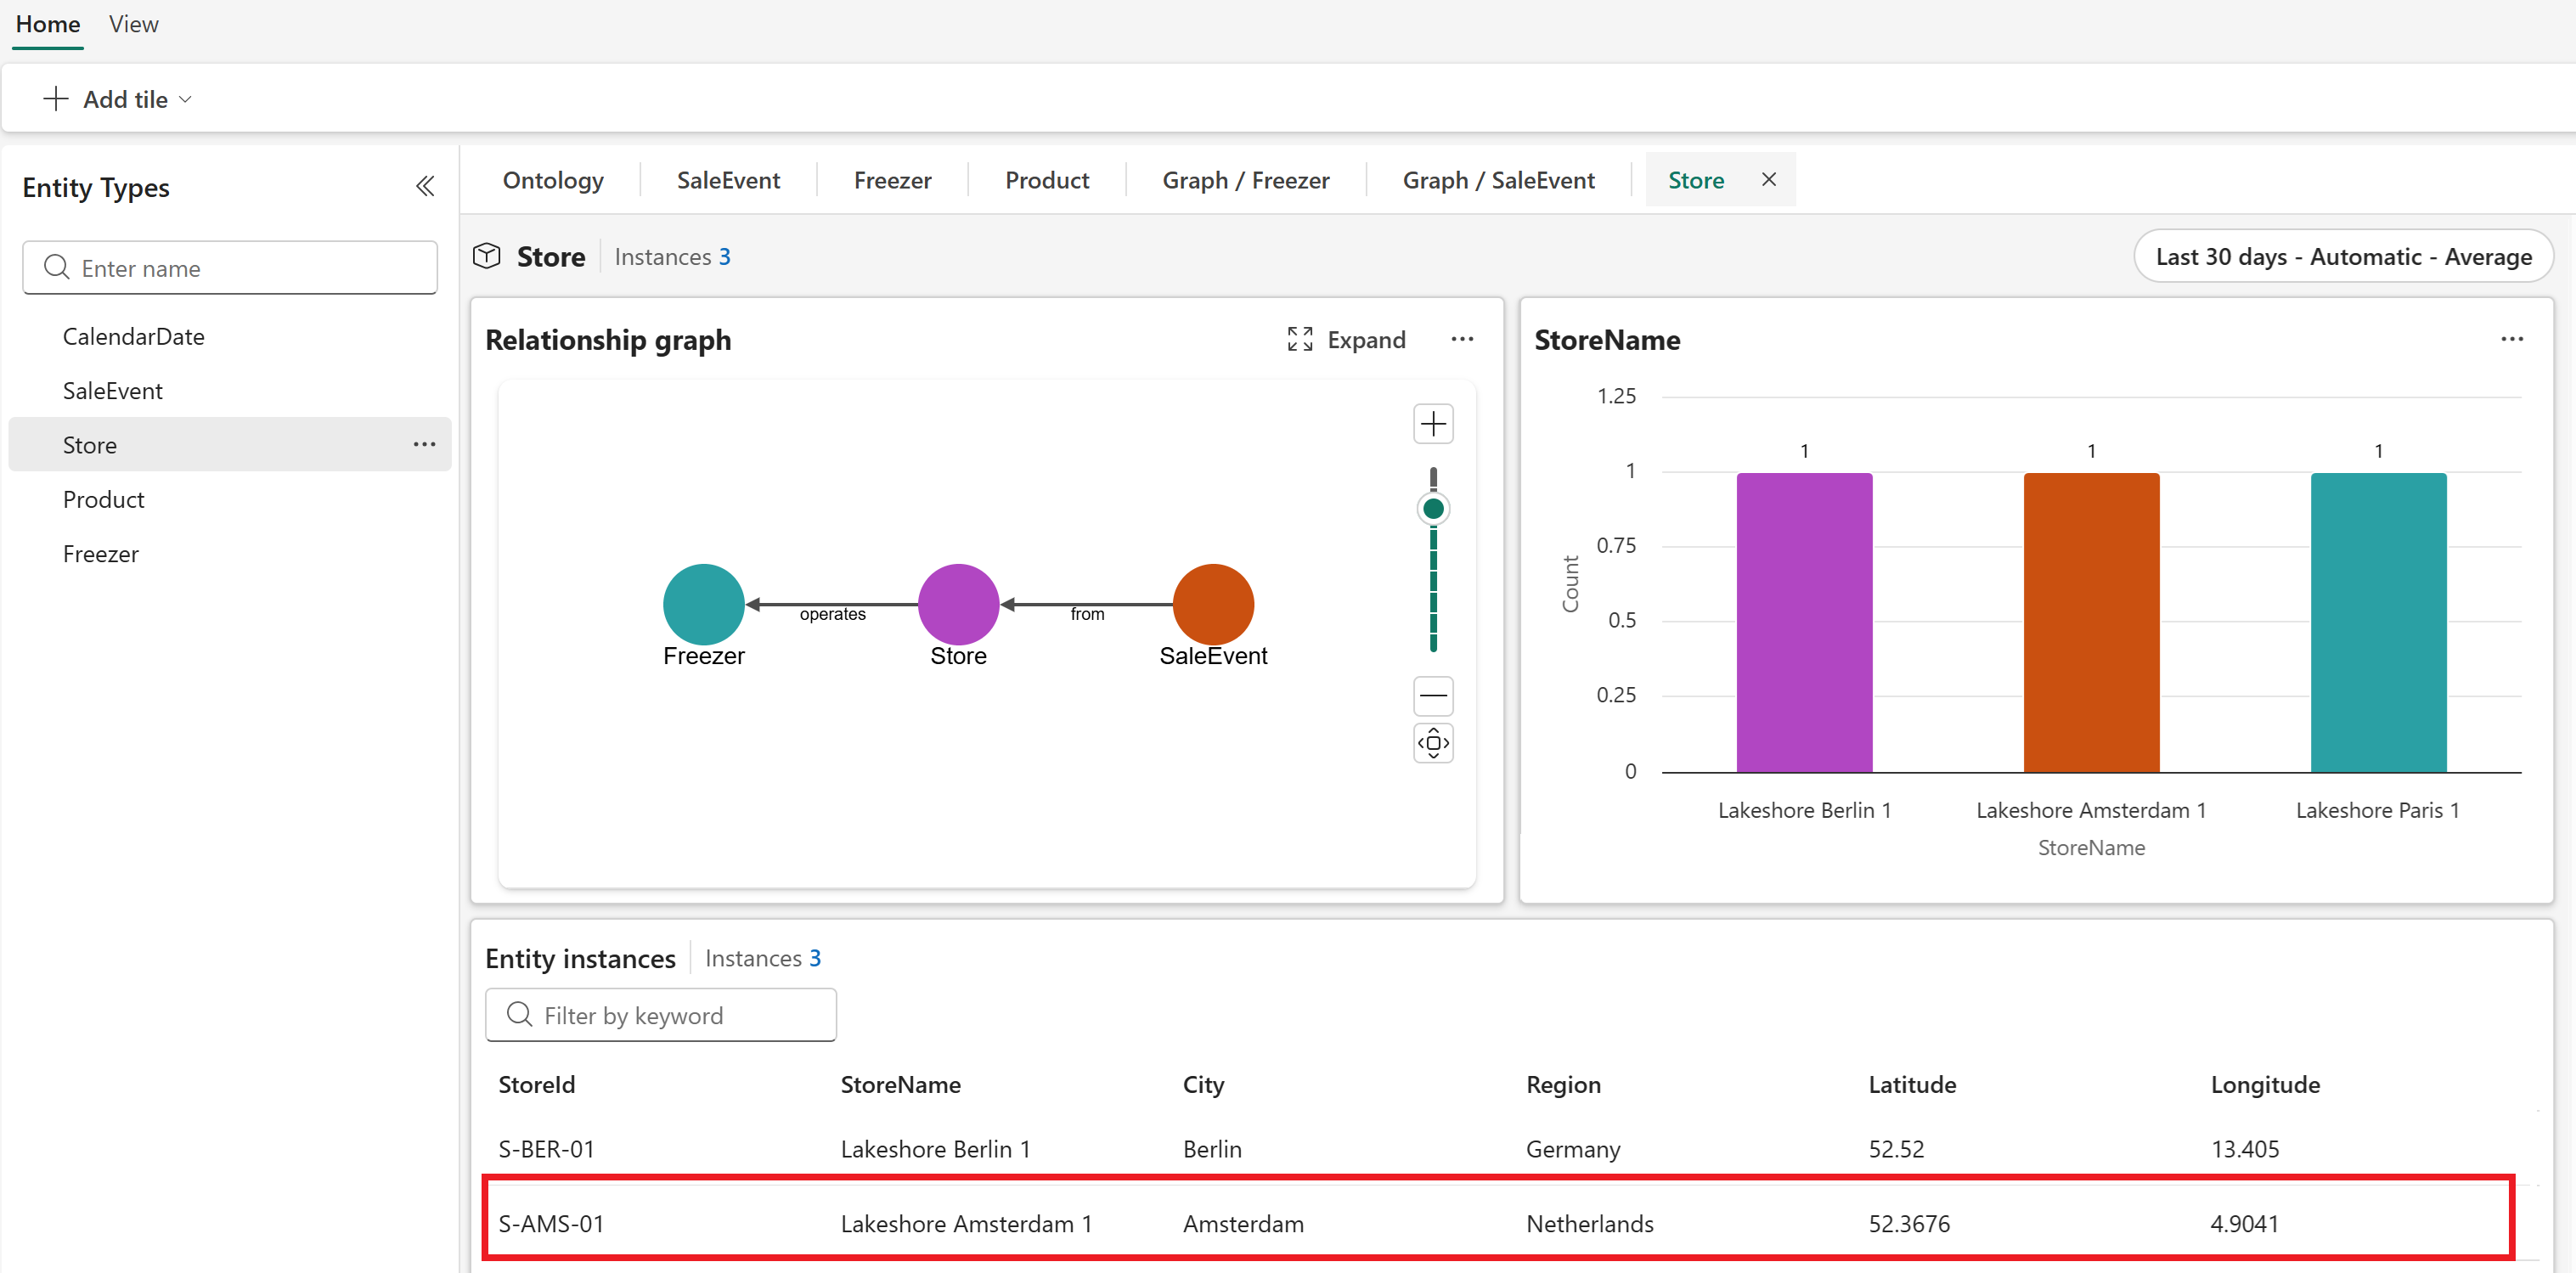
The instance view displays any tiles you configured at the entity type level, and any specific properties bound to this instance.

You can also Expand the graph view, where you can run a query specific to this entity instance. This graph view is similar to the general graph view for the entity type view, but scoped to this particular instance and its relationships.

Refresh the graph model
This section describes how and when your bound data stays up to date in your ontology (preview) item.
Downstream experiences automatically refresh whenever you make changes to your ontology schema. This feature ensures that whenever you add, edit, or remove any element like properties, types, or relationships, the system re-ingests all currently bound data to keep your downstream experiences in sync with the latest schema adjustments.
However, this automatic refresh only applies to changes made within the schema itself. If there are changes to the external data source that feeds your graph (for example, if new records are added, updated, or deleted in the upstream system), the graph doesn't know about these changes unless you explicitly inform it. In this case, your graph might display stale data until a new ingestion is triggered. You can enforce an update by manually refreshing the graph.
Important
We recommend batching updates for refresh instead of refreshing the graph after every individual change, as the graph does a full refresh each time. This approach has cost implications for the Graph in Microsoft Fabric item.
To refresh the graph, follow these steps:
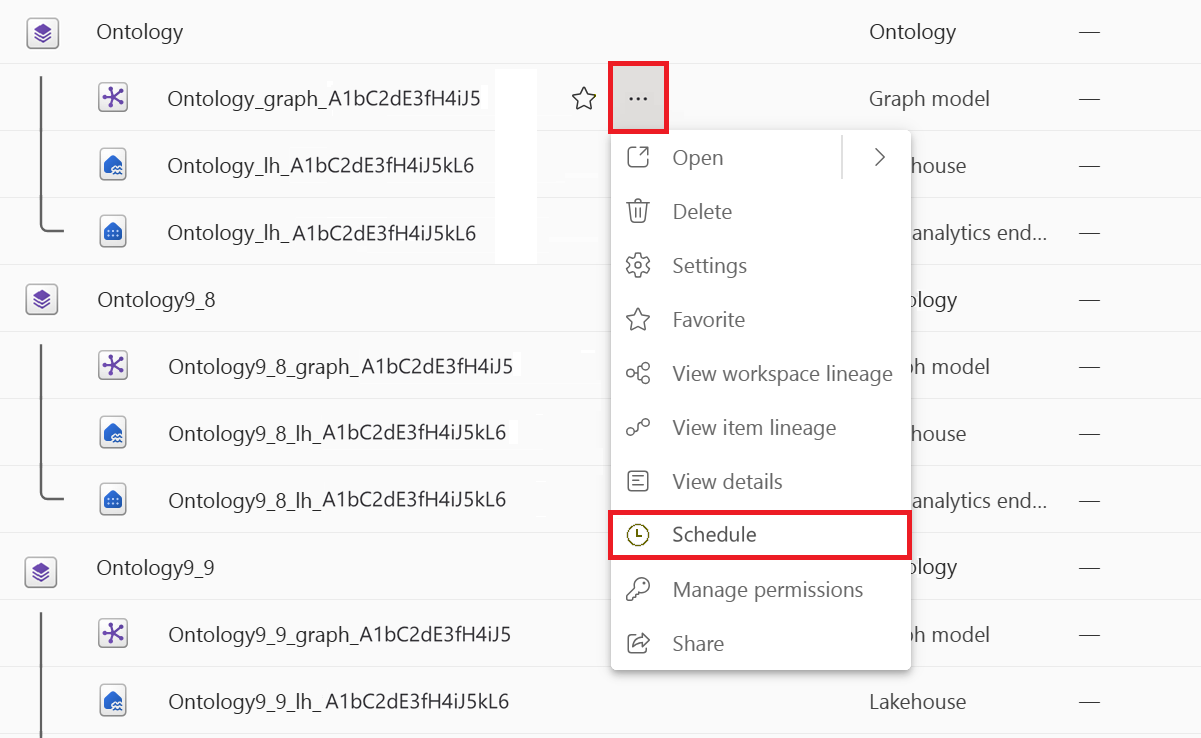
Go to your Fabric workspace, and locate the graph model associated with your ontology (preview) item.
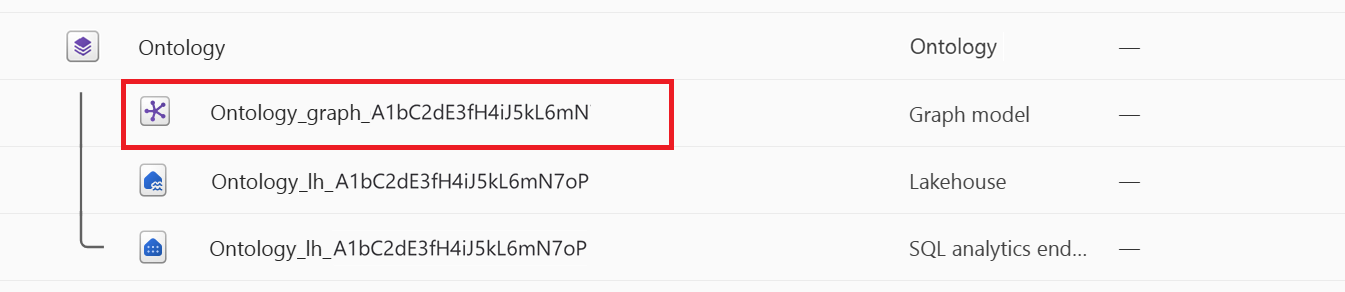
Select ... to expand the option menu for the graph model, and select Schedule.
In the Schedule view, select Refresh now.
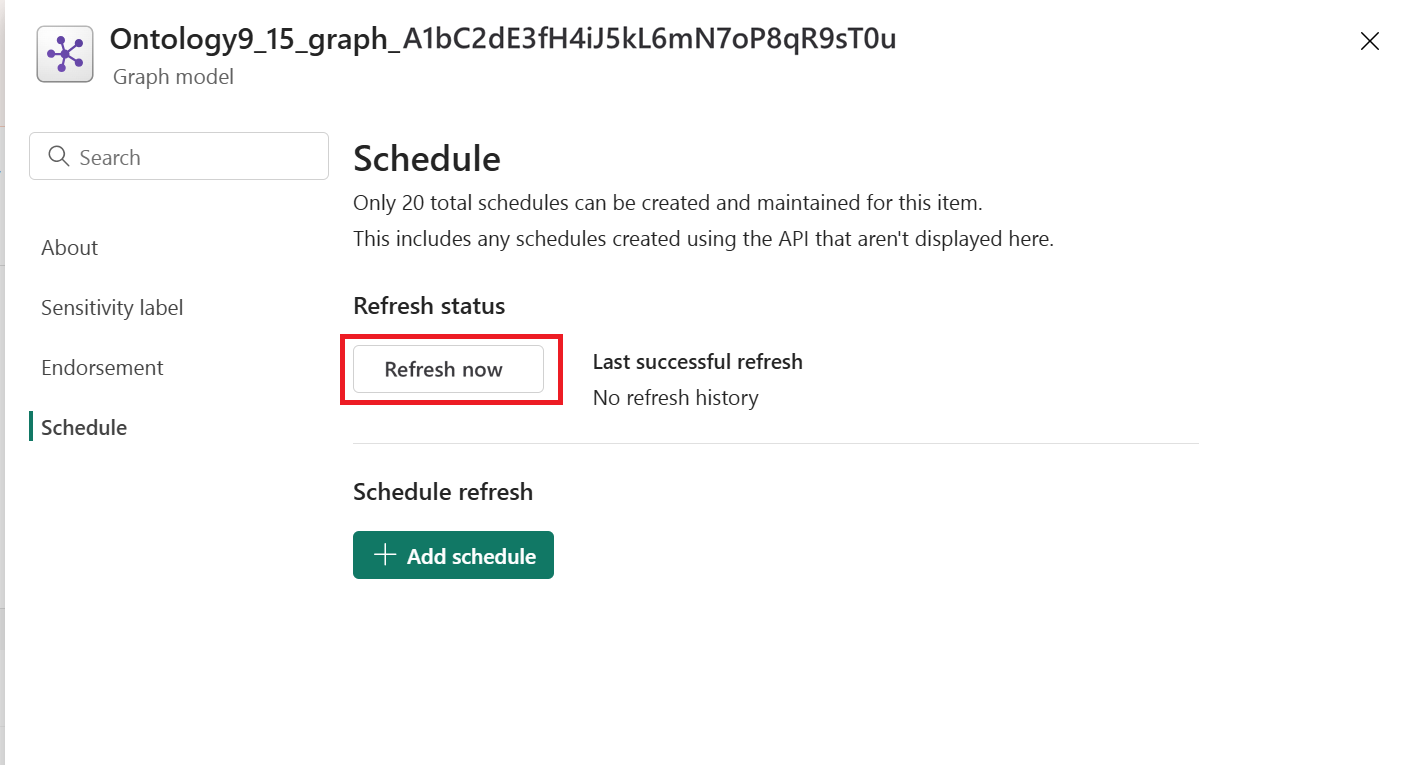
![TIP] You can also use this panel to manage a recurring refresh schedule for the graph model, to keep your ontology (preview) data up to date automatically on a specified cadence.
Verify that when you return to the ontology item, the data shown reflects your changes.
Troubleshooting
For troubleshooting tips related to the preview experience in ontology (preview), see Troubleshoot ontology (preview).