Note
Access to this page requires authorization. You can try signing in or changing directories.
Access to this page requires authorization. You can try changing directories.
Azure DevOps Services | Azure DevOps Server | Azure DevOps Server 2022
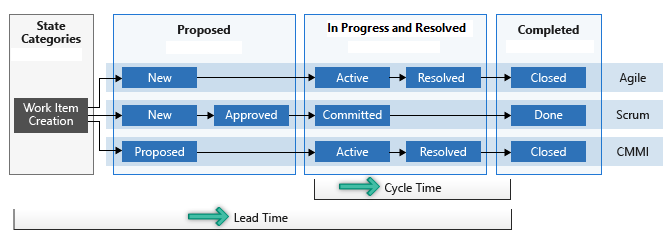
The lead time and cycle time widgets show how long it takes for work to flow through your development pipeline. Lead time is the total time from when a work item is created to when it's finished. Cycle time is the time it takes your team to finish work items after they start working on them.
Tip
You can use AI to help with this task later in this article, or see Enable AI assistance with Azure DevOps MCP Server to get started.
Key definitions
Lead time — The elapsed time from when a work item is created until it reaches a Completed state. Use lead time to estimate delivery times and track SLAs.
Cycle time — The elapsed time from when a work item first enters an In Progress state until it reaches a Completed state. Use cycle time to identify process bottlenecks and measure team efficiency.
The following diagram shows how the two metrics differ. For more information about how states map to these calculations, see About workflow states in backlogs and boards.
How cycle time handles reactivated work items
For work items that are reactivated (moved from a Completed state back to an In Progress state), cycle time starts from the first time the work item enters an In Progress or Resolved state category and ends the final time it enters a Completed state category. Cycle time includes the entire active work period, including any time after reactivation.
Example scenario:
- New → Active → Resolved → Closed → New → Active → Closed
- Cycle time calculation: From the first transition to Active to the final transition to Closed
- Total cycle time: Includes both active work periods and the time in Closed state before reactivation
This calculation method gives a complete picture of the total time needed to finish the work item, including any rework or extra effort after reactivation. Lead time calculation follows the same principle—it covers the entire period from work item creation to final completion, regardless of any intermediate completed states.
Lower lead and cycle times mean faster team throughput. Check these charts before or during each retrospective to find variations in efficiency and spot process problems. For more information, see Cumulative flow, lead time, and cycle time guidance.
Prerequisites
| Category | Requirements |
|---|---|
| Access levels | - Project member. - At least Basic access. |
| Permissions | - Team administrator or project administrator or specific dashboard permissions granted to you. - To add a widget to a team dashboard: Member of the team. |
| Feature enablement | Azure Boards enabled. If disabled, none of the work-tracking Analytics widgets are displayed. To re-enable it, see Turn a service on or off. |
| Task awareness | Awareness of any required or recommended tasks listed later in this article. |
| Category | Requirements |
|---|---|
| Access levels | - Project member. - At least Basic access. |
| Permissions | - Team administrator or project administrator or specific dashboard permissions granted to you. - To add a widget to a team dashboard: Member of the team. |
| Feature enablement | - Azure Boards enabled. If disabled, none of the work-tracking Analytics widgets are displayed. To re-enable it, see Turn a service on or off. - Analytics installed and enabled. Members of the Project Collection Administrators group can add extensions or enable the service. Organization owners are automatically members of this group. |
Your team's board must have columns and swimlanes configured to support your workflow.
Configure the Cycle Time or Lead Time widget
The configuration dialog is the same for both widgets. The widget catalog offers two widgets: Cycle Time and Lead Time.
Add the widget to your dashboard, select the
 actions icon, and select Configure.
Set the following values:
Setting Description Title Modify the widget title. Team Select the team to track. Work items Select the backlog level or work item type. To select a Swimlane, choose a Backlog work item type. Field criteria (Optional) Filter work items by field values, such as Release = Milestone 1. If you don't supply values, the widget includes all matching work items. Time period Choose Rolling period for continuous flow (specify the number of days), or Start date for a fixed scope view (useful for Scrumban or standard sprint processes). 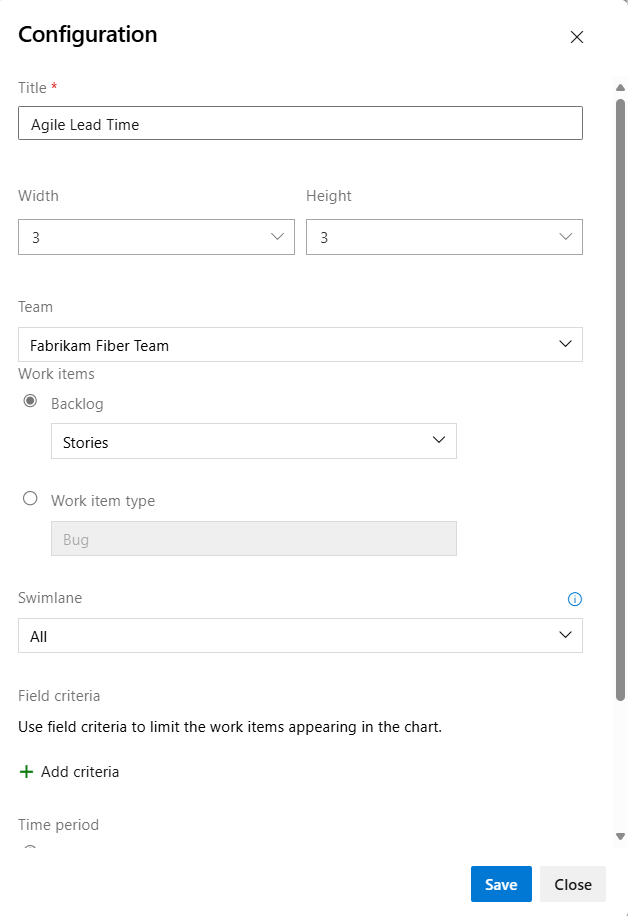

Note
You can only select work item types that are added to a backlog. To add work item types to a backlog, see Customize your backlogs or boards (Inheritance process). For on-premises XML process, see Process configuration XML element reference.
Select Save. The following image shows an example Lead Time chart showing 60 days of data.

For your charts to provide useful data, your team needs to quickly update work item status as work progresses.
Understand the chart
Both Lead Time and Cycle Time widgets display as scatter-plot charts with summary information and interactive elements.
Example Lead Time widget
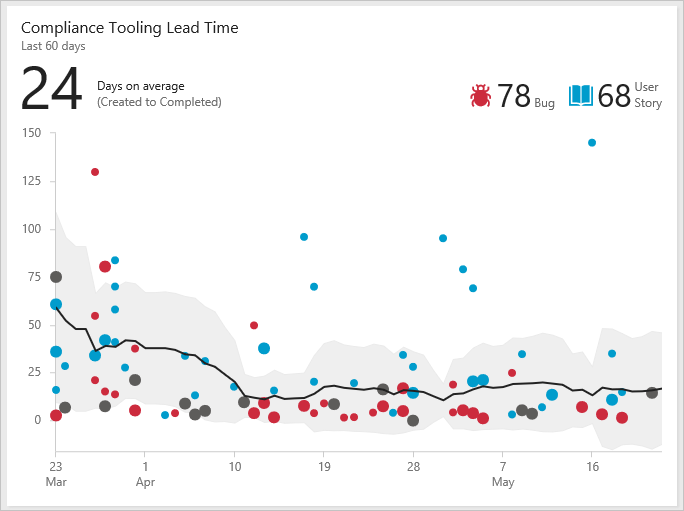
Each dot represents one or more completed work items. The horizontal axis shows the completion date, and the vertical axis shows the lead time or cycle time in days.
- Larger dots represent multiple work items with the same time value.
- Dot color matches the work item type shown in the legend.
- Dark gray dots represent a mix of work item types.
Summary elements
| Element | Description |
|---|---|
| Average days | The average lead time or cycle time for the work item types shown. The average is calculated from all completed work items within the chart's time period. |
| Work item counts | The number of completed work items used in the calculations. If you track more than three work item types, the extra types are grouped under Other. |
| Trend line | The black line shows the moving average over time. |
| Standard deviation band | The shaded band around the trend line shows the standard deviation — the range of typical variation. |
Interactive elements
- Hover over any dot to see which work items make up the data point and the lead time or cycle time for those items.
- Select a dot to open the work item or a query that lists the work items.
- Filter the chart by selecting a work item type in the legend (
 ,
,  , or another icon) to filter on that type. To go back to the original chart, refresh the dashboard.
Moving average and standard deviation calculations
Daily moving average: The average of data points in the moving average window, based on the current day and previous N days. N is 20 percent of the number of days the chart shows, rounded down to the nearest odd number.
- Example: If the chart shows the last 30 days, then N = 5 days (20 percent of 30 days is 6, rounded down to 5).
Moving average window: For April 10, the window is the previous five days. The April 10 moving average is the average of all data points from April 5 to April 10.
- If the moving average window doesn't have any data points, the chart doesn't show a moving average line. This condition can happen if there aren't enough days to calculate a moving average.
Standard deviation: Shows as a band around the moving average and is calculated from all data points in the same moving average window.
- If the moving average window doesn't have any data points, the chart doesn't show standard deviation.
Add a widget programmatically
You can add a Lead Time or Cycle Time widget to a dashboard by using the Dashboard Widgets REST API. Use a POST request to the following endpoint:
POST https://dev.azure.com/{organization}/{project}/{team}/_apis/dashboard/dashboards/{dashboardId}/widgets?api-version=7.1-preview.2
Use AI to analyze cycle time and lead time
If you configure the Azure DevOps MCP Server, you can use AI assistants to help interpret and improve your cycle time and lead time metrics.
Example prompts
| Task | Example prompt |
|---|---|
| Understand metrics | Explain the difference between lead time and cycle time and which one I should focus on for my team in <Contoso> project |
| Identify bottlenecks | Help me analyze why cycle time is increasing for user stories in <Contoso> project |
| Set targets | What are reasonable lead time targets for bug fixes based on industry best practices? |
| Reduce cycle time | Suggest process improvements to reduce cycle time for my Scrum team in <Contoso> project |
| Configure the widget | Help me configure a cycle time widget that tracks bugs completed in the last 6 sprints in <Contoso> project |
| Spot trends | How should I interpret the moving average line on my lead time chart and what actions should I take when it trends upward? |
| Compare work types | Compare the average cycle time for user stories versus bugs over the last 90 days in <Contoso> project and tell me which type is taking longer |
| Detect outliers | Identify work items in <Contoso> project that fall outside the standard deviation band on my cycle time chart and suggest what caused the delays |
| Plan capacity | Based on our current lead time trends in <Contoso> project, how many work items can my team realistically deliver in the next sprint? |