My ultimate goal is to create a simple ROI calculator in Excel that creates all charts/graphs needed to update a PowerPoint Presentation and then automatically updates the PowerPoint Presentation when the Excel data changes (ie when the ROI data is updated)
In the past, I have been able to use the "Paste As Link" function to paste an Excel Chart/Graph into a PPT slide that will automatically update the PPT charts/graphs when the Excel data changes.... it worked
BEAUTIFULLY (but was years ago)
I am now using Office 365 Desktop on a MacBook Air and the option is nowhere to be found. I've tried using the
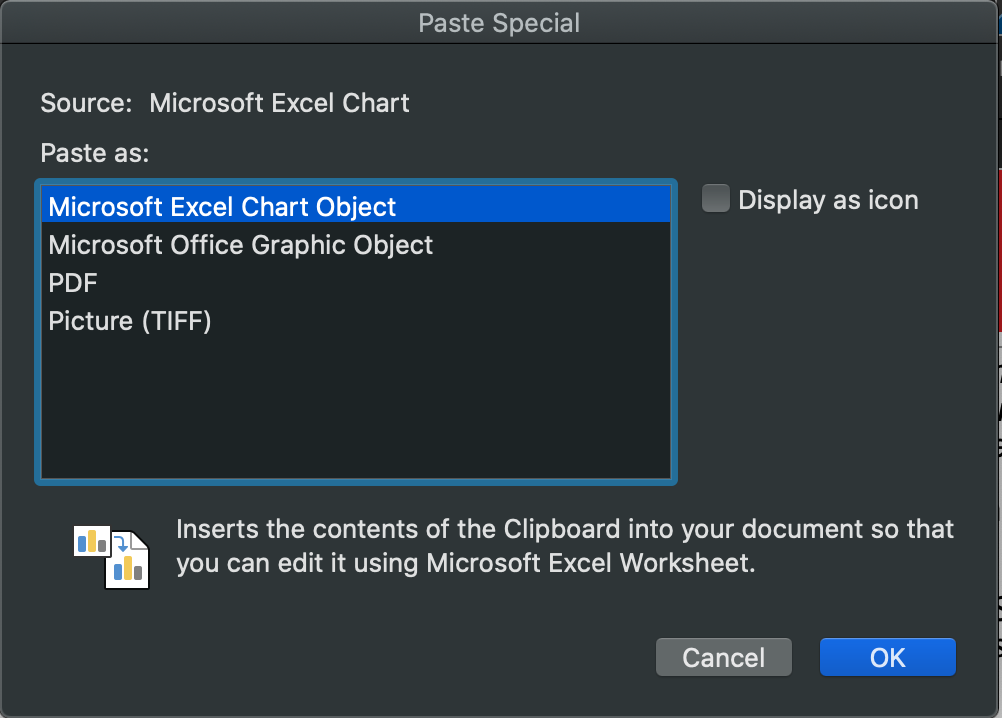
Paste Special > Paste as 'Microsoft Excel Worksheet Object' and it pastes the data, but does not update the chart when the data changes and displays an empty box when a graph is pasted.
Paste Options used/results:
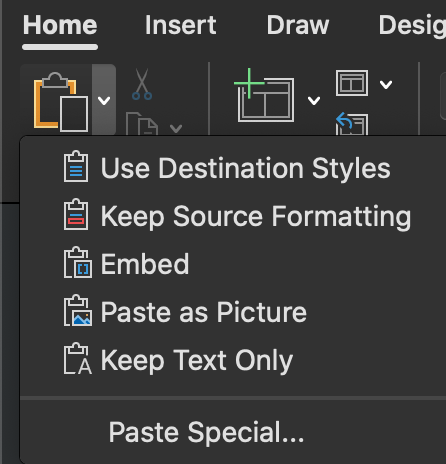
- Chart Data from Excel
- 'Use Destination Styles' = chart pastes fine, but doesn't update
- 'Keep Source Formatting' = chart pastes fine, but doesn't update
- 'Embed' = chart pastes fine, but doesn't update
- 'Microsoft Excel Worksheet Object' = chart pastes fine, but doesn't update
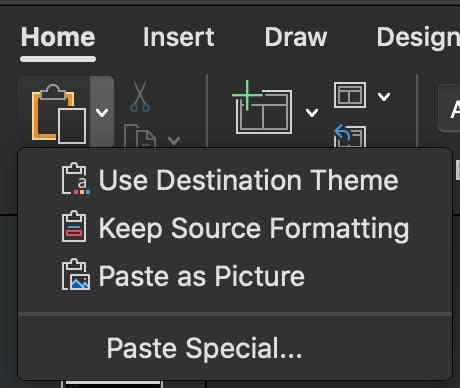
- Graph Data from Excel
- 'Use Destination Theme' = graph pastes fine, but doesn't update (even when 'Refresh Data' is clicked)
- 'Keep Source Formatting' = graph pastes fine, but doesn't update (even when 'Refresh Data' is clicked)
- 'Microsoft Excel Chart Object' = blank box
- 'Microsoft Excel Graphic Object' = graph pastes fine, but doesn't update (even when 'Refresh Data' is clicked)
Does anyone know the best way to link the Excel Chart/Graph data into the PowerPoint Presentation so it automatically updates?
Also, could this be a limitation for the Mac version of Office 365?
Thank you for the help!
Screenshots:
Dropdown Paste Options (chart data from Excel in clipboard):
Paste Special options when chart data is in the clipboard from Excel:

Dropdown Paste Options (graph data from Excel in clipboard):
Paste Special options when graph data is in the clipboard from Excel:
' cx='32' cy='32' r='32' /%3E%3Ctext x='50%25' y='55%25' dominant-baseline='middle' text-anchor='middle' fill='%23FFF' %3EA%3C/text%3E%3C/svg%3E)